Mastering Web Scraper Logging and Alerts with ELK Stack
When dealing with software, things break. Web scrapers are no exception to this rule.
Whether it's just a small change or a complete site redesign, these changes can leave your scraper stranded trying to look for a page element that no longer exists.
In this situation, a good scraper should throw an error and write it to a log file. A good stack can read this log file and let you know that something is broken.
"In these situations, you might find it more comfortable to move the monitor closer to the front of the desk than you would ordinarily have it. You'll find this makes it much easier to repeatedly bang your head against it when you're feeling particularly frustrated."
--Pete Goodliffe, Becoming a Better Programmer
ELK (Elasticsearch, Logstash, Kibana) Stack eliminates the need to manually dig through log files. You can find your broken scrapers in a snap... no head banging required!
In this guide, we'll walk you through installing the ELK (Elasticsearch, Logstash, Kibana) stack, integrating your scraper logs, and setting up real-time alerts.
- TLDR: Quick Takeaways
- Why ELK? The Power of Centralized Logging
- Setting Up the ELK Stack on Your Local Machine
- Integrating Logging into Your Web Scraper
- Sending Logs to ELK and Visualizing in Kibana
- Automating Alerts for Scraper Failures
- Scaling Your ELK-Based Logging System
- Tips and Troubleshooting
By the end, you'll have a fully functioning local setup that gives you complete visibility into your web scraping workflows, no more silent failures.
TLDR: Quick Takeaways
- ELK Stack centralizes logs from multiple scrapers, making them searchable and easy to visualize.
- Logstash ingests your scraper logs, pushes them to Elasticsearch, and Kibana provides a slick web interface for filtering and analyzing them.
- Alerts can be configured to fire on specific log patterns (e.g.,
level:ERROR), letting you know the moment something breaks. - Scaling is straightforward by containerizing or distributing the stack, and you can tweak resource usage to avoid crashing your local machine.
Need help scraping the web?
Then check out ScrapeOps, the complete toolkit for web scraping.
Why ELK? The Power of Centralized Logging
Logging is Critical: Scrapers need to log their actions. Without logging, you might not spot broken code until the data has made it into your report.
A single web scraper can have a variety of logs: debug messages, site structure changes, or authentication errors. Multiply this by multiple scrapers, and you have a logging nightmare.
Enter the ELK Stack: With logging, you're not just jotting down events, you're keeping track of things in real time to stay ahead of potential issues. A plaintext log file will tell you what's wrong, but sometimes it takes hours, even days to even find an error.
ELK stack processes our logs for us. This way, you don't need to dig through the muck.
-
Elasticsearch: A backend API that can effectively process and serve your logs.
-
Logstash: Process your logs and feed them into the Elasticsearch backend.
-
Kibana: A highly intuitive web app that visualizes the Elasticsearch backend in your browser.
ELK doesn't give you a basic log. You get a complete webapp fully integrated with your logs to utilize them however you might need.
By centralizing logs from all your scrapers, you can quickly spot issues, like 404 errors, missing data, or website layout changes, without scanning endless text files.
Setting Up the ELK Stack on Your Local Machine
Next, we'll go through the requirements of setting up ELK stack.
Elasticsearch Setup
The following instructions will work with a native Ubuntu install or Ubuntu using WSL. If you need to install on a different OS, Elastic has you covered here.
Installing Elasticsearch
To start, we need to download the Elasticsearch keyrings. These are used to cross check our build and ensure its integrity.
curl -fsSL https://artifacts.elastic.co/GPG-KEY-elasticsearch |sudo gpg --dearmor -o /usr/share/keyrings/elastic.gpg
Next, we need to add Elasticsearch to the source.d directory. This is where it actually gets installed on Ubuntu.
echo "deb [signed-by=/usr/share/keyrings/elastic.gpg] https://artifacts.elastic.co/packages/7.x/apt stable main" | sudo tee -a /etc/apt/sources.list.d/elastic-7.x.list
Update your APT repositories. The Ubuntu package manager uses these repos to install software on your computer.
sudo apt update
We're finally ready to install Elasticsearch.
sudo apt-get install elasticsearch
After installing, you should see this output or something similar.
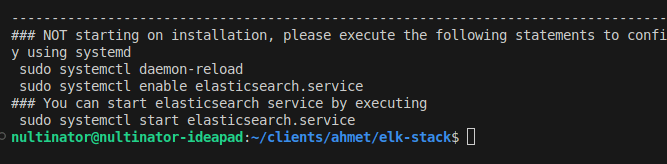
Starting Elasticsearch
Start Elasticsearch. systemctl allows you to run it as a background process.
sudo systemctl start elasticsearch
Optionally, you can set Elasticsearch to start automatically whenever the system boots.
sudo systemctl enable elasticsearch
Create a new password. This password will give you superuser access to Elasticsearch. We'll use it to login to Kibana later on.
sudo /usr/share/elasticsearch/bin/elasticsearch-reset-password -u elastic
When prompted, enter y to randomly create a new password and you should see output similar to this.
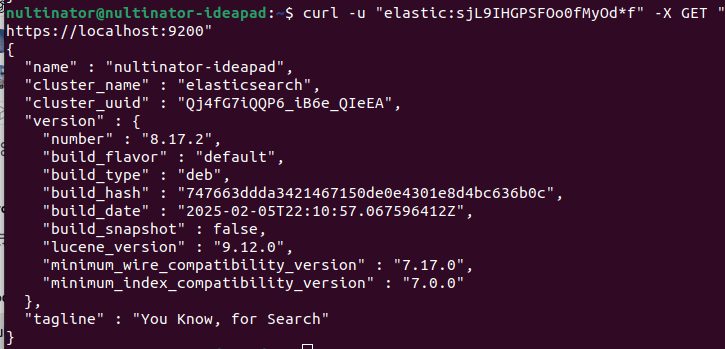
Testing with curl.
curl -u "elastic:<YOUR_PASSWORD>" -X GET "https://localhost:9200"
If it's running properly, it should spit out a JSON object with basic information about your Elasticsearch build.
Logstash Setup
This part's pretty similar to Elasticsearch. The following instructions will work with a native Ubuntu install or Ubuntu using WSL.
Installing Logstash
Start by getting the logstash signing key.
wget -qO - https://artifacts.elastic.co/GPG-KEY-elasticsearch | sudo gpg --dearmor -o /usr/share/keyrings/elastic-keyring.gpg
Install apt-transport-https. Logstash uses it to communicate with our Elasticsearch backend.
sudo apt-get install apt-transport-https
Save the repo information to your Elasticsearch configuration.
echo "deb [signed-by=/usr/share/keyrings/elastic-keyring.gpg] https://artifacts.elastic.co/packages/8.x/apt stable main" | sudo tee -a /etc/apt/sources.list.d/elastic-8.x.list
Install Logstash.
sudo apt-get update && sudo apt-get install logstash
Starting Logstash
Start Logstash.
sudo systemctl start logstash
Optionally, you can set Logstash to start automatically whenever the system boots.
sudo systemctl enable logstash
Kibana Setup
Finally, we'll install Kibana.
Installing Kibana
The good news is that Kibana is already included with the repositories we added earlier.
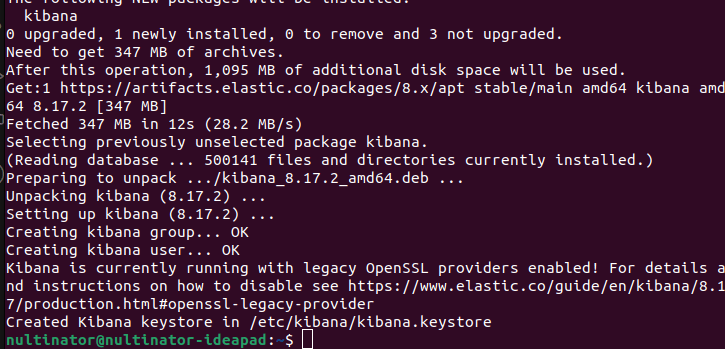
sudo apt-get install kibana
Successful installation will look like this.
Starting Kibana
Start Kibana.
sudo systemctl start kibana
Optionally, you can set Kibana to start automatically whenever the system boots.
sudo systemctl enable kibana
Generate a new enrollment token.
sudo /usr/share/elasticsearch/bin/elasticsearch-create-enrollment-token --scope kibana
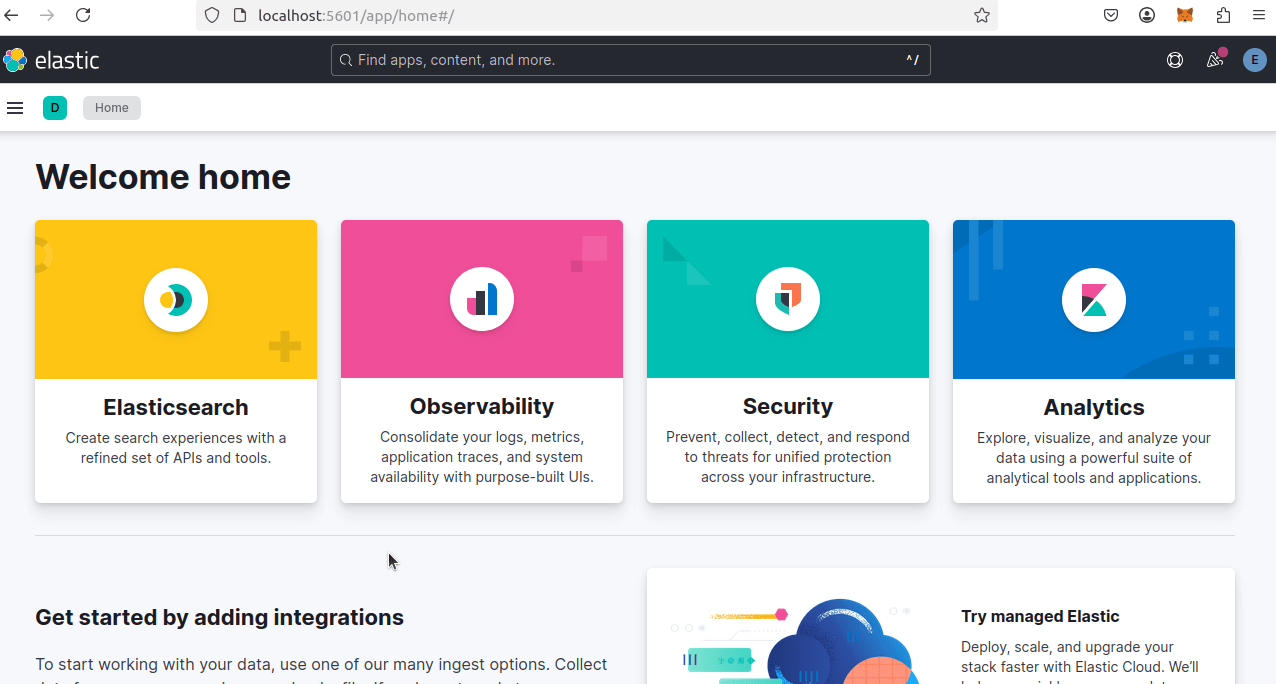
You can access Kibana at http://localhost:5601/. Enter your new enrollment token into the input box.
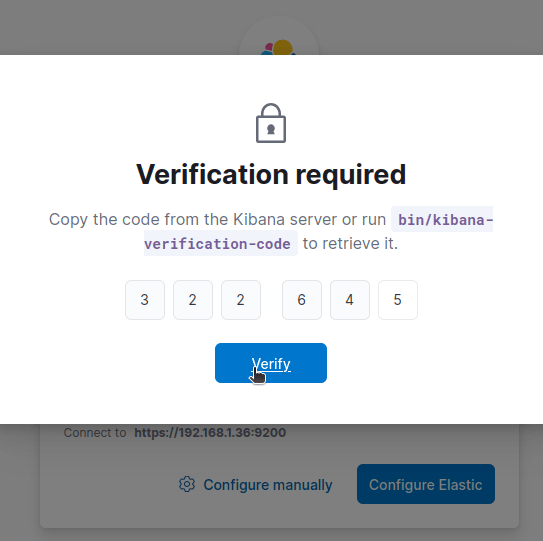
Get your Kibana verification code.
sudo /usr/share/elasticsearch/bin/elasticsearch-create-enrollment-token --scope kibana
Enter the verification code.
Setup takes a minute or two. Then you need to get logged in. Use elastic as your username and the password you created when setting up Elasticsearch.
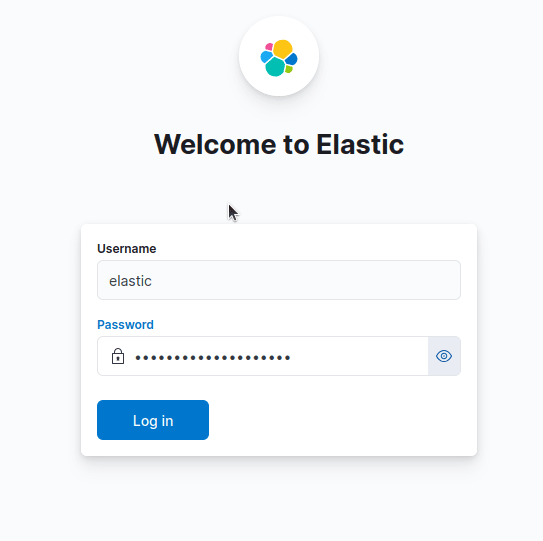
Finally, you'll be taken to the Kibana dashboard.
Integrating Logging into Your Web Scraper
For those of you unfamiliar with the process, we'll create a basic web scraper. Nothing fancy, just scrape a few quotes and add some basic logging info.
In your own personal ELK stack, this piece will differ, but the concepts remain the same.
Implementing a Robust Logging System in Python
import logging
import os

#make sure that we have a "logs" folder
os.makedirs("logs", exist_ok=True)

#configure logging
logging.basicConfig(
    filename="logs/scraper.log",
    level=logging.DEBUG,
    format="%(asctime)s - %(levelname)s - %(message)s",
    datefmt="%Y-%m-%d %H:%M:%S",
)

logger = logging.getLogger(__name__)

#begin log messages
logger.info("Web scraper initialized.")
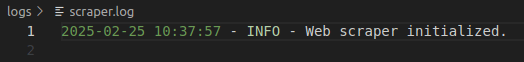
Sample Web Scraper with Logging
Next, we add some simple scraping logic to our logger.
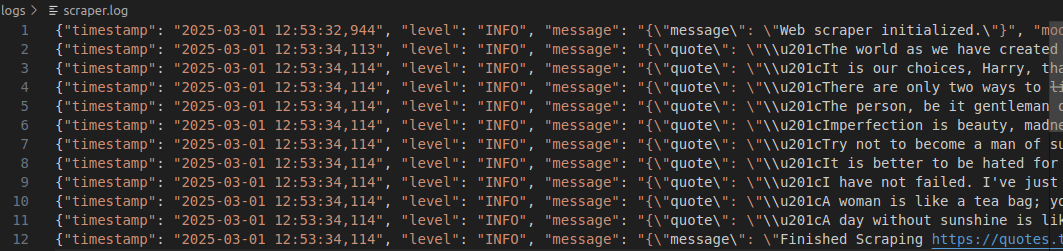
We create a JsonFormatter class to automatically convert our data into JSON as we pass it into the log.
Most APIs like JSON data and Elasticsearch is no exception. Our second url variable is commented out.
We'll use it to automatically trigger errors later on. In production, you won't need this.
import logging
import json
import os
import requests
from bs4 import BeautifulSoup

# Ensure "logs" folder exists
os.makedirs("logs", exist_ok=True)

# Define a custom JSON formatter
class JsonFormatter(logging.Formatter):
    def format(self, record):
        log_entry = {
            "timestamp": self.formatTime(record, self.datefmt),
            "level": record.levelname,
            "message": record.getMessage(),
            "module": record.module,
            "function": record.funcName,
            "line": record.lineno
        }
        return json.dumps(log_entry)

# Configure logging with JSON formatter
logger = logging.getLogger(__name__)
logger.setLevel(logging.DEBUG)

file_handler = logging.FileHandler("logs/scraper.log", mode="a", encoding="utf-8")
file_handler.setFormatter(JsonFormatter())

logger.addHandler(file_handler)

# Log the initialization message
logger.info(json.dumps({"message": "Web scraper initialized."}))

def scrape_page(url):
    response = requests.get(url)
    try:
        response.raise_for_status()
        soup = BeautifulSoup(response.text, "html.parser")
        quotes = soup.find_all(class_="quote")
        for quote in quotes:
            log_data = {
                "quote": quote.text.strip(),
                "url": url
            }
            logger.info(json.dumps(log_data))
    except Exception as e:
        logger.error(json.dumps({"error": str(e), "url": url}))
    finally:
        logger.info(json.dumps({"message": f"Finished Scraping {url}"}))

if __name__ == "__main__":
    url = "https://quotes.toscrape.com"
    #url = "https://httpbin.org/500"
    scrape_page(url)
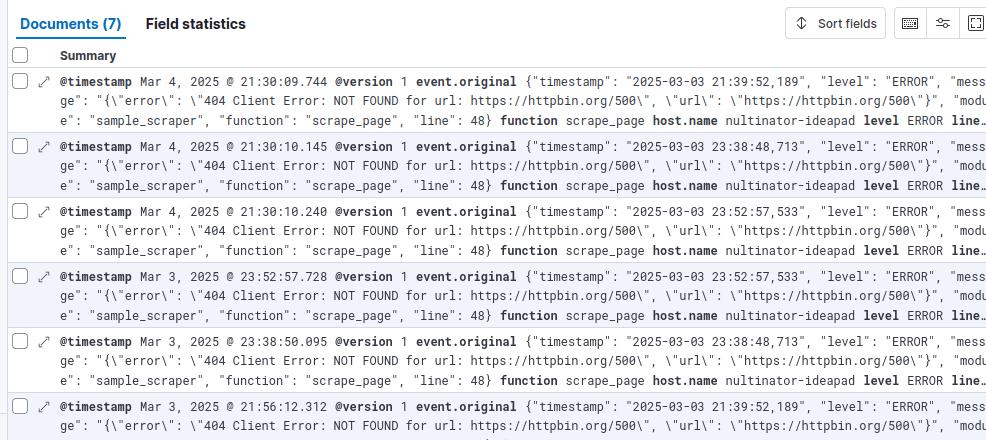
If we run our scraper and check the log, we now log each quote found in the page. At the bottom of the log, you'll see the exit message we created.
Afterward, comment out url = "https://quotes.toscrape.com" and uncomment #url = "https://httpbin.org/500". Run the scraper again to create an error in the logs.
Sending Logs to ELK and Visualizing in Kibana
Next, we'll configure Logstash to process our logs and send them to Elasticsearch.
Configuring Logstash to Process Logs
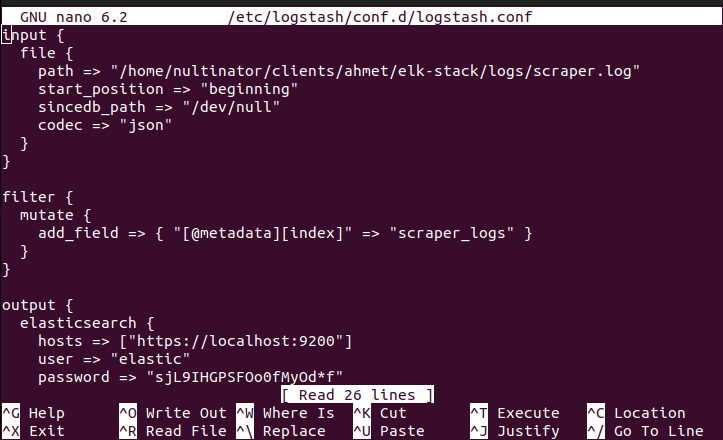
First, we'll create a configuration file for Logstash and open it in a text editor.
We're using nano since its installed by default in the command line, but this isn't a requirement.
sudo nano /etc/logstash/conf.d/logstash.conf
Paste the following code into the file.
Later on, we'll create an index for our scraper logs.
Next, do the following:
- Replace the
pathwith the path to your desired log. - Replace
scraper_logswith your index name. - Replace the
passwordwith the password you generated earlier.
This is the same one you used to log into Kibana.
input {
  file {
    path => "/home/nultinator/clients/ahmet/elk-stack/logs/scraper.log"
    start_position => "beginning"
    sincedb_path => "/dev/null"
    codec => "json"
  }
}

filter {
  mutate {
    add_field => { "[@metadata][index]" => "scraper_logs" }
  }
}

output {
  elasticsearch {
    hosts => ["https://localhost:9200"]
    user => "elastic"
    password => "sjL9IHGPSFOo0fMyOd*f"
    index => "%{[@metadata][index]}"
    ssl_certificate_verification => false
  }

  stdout { codec => rubydebug }
}
Using Kibana to Analyze and Filter Logs
Now, from Kibana, click on Stack Management in the Navbar.
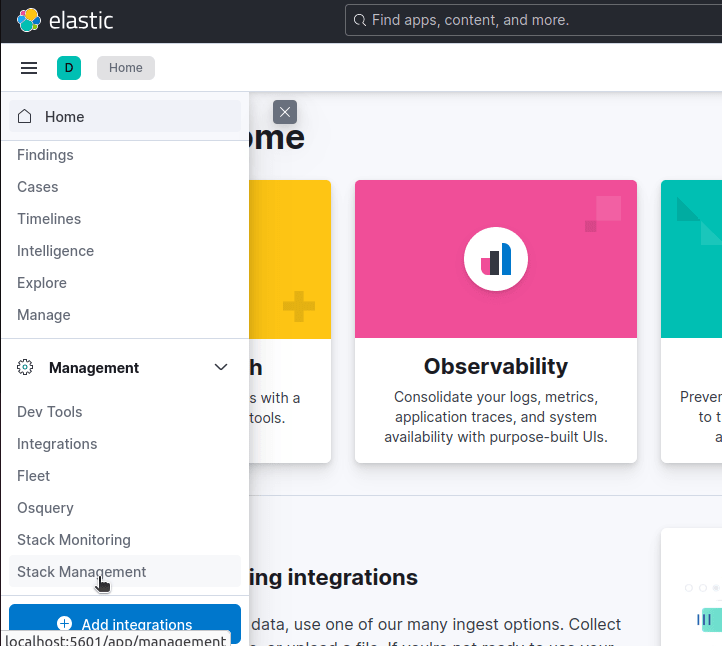
Next, click Index Management.
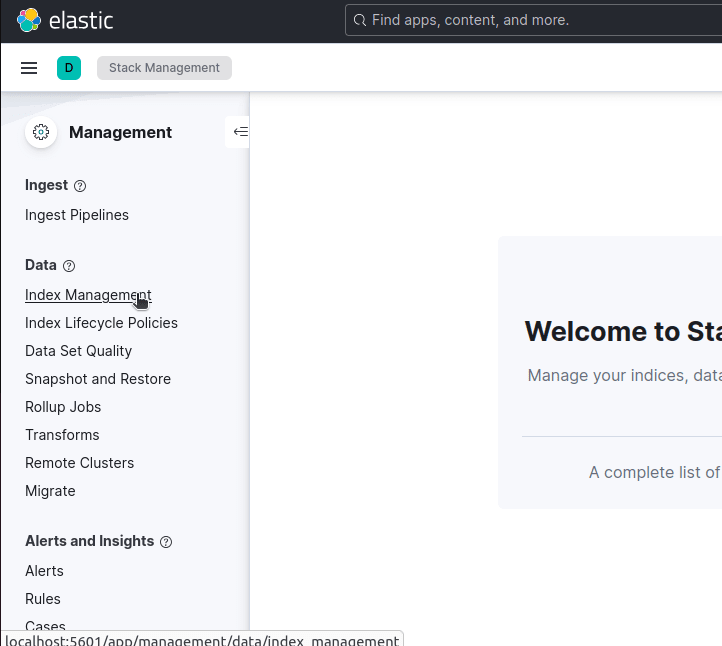
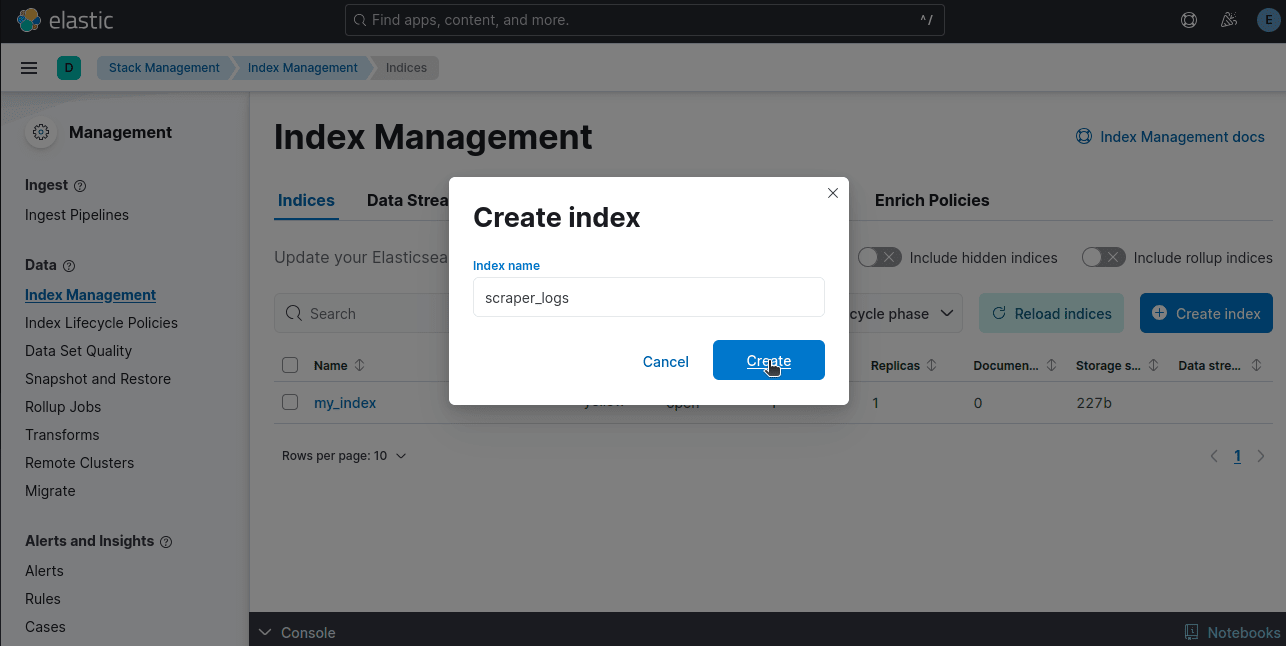
Now, you can click the Create Index button and follow the prompts to create your index. Give this index the same name you used in your Logstash configuration file earlier.
If your logs aren't showing up, you'll need to click on Discover index.

Hover over level on the sidebar and you should see a popup. Click Filter for level: ERROR.
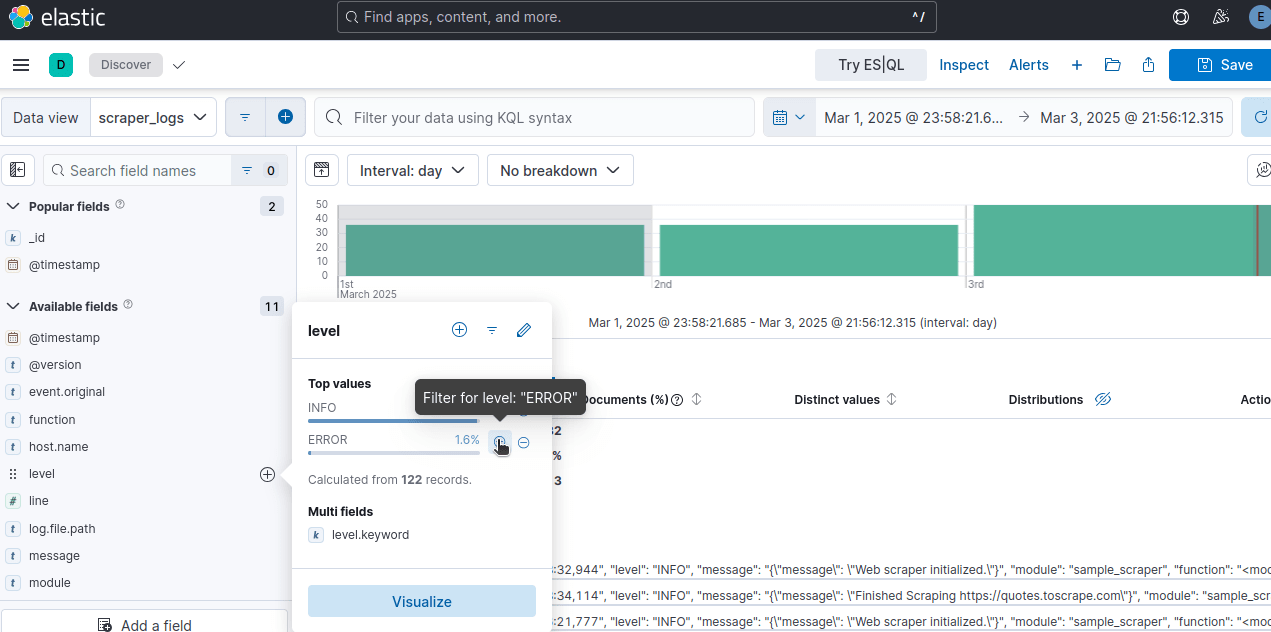
Afterward your display should filter out all non-error logs.
Creating Visualizations
Next, we'll create a visualization to display our logs.
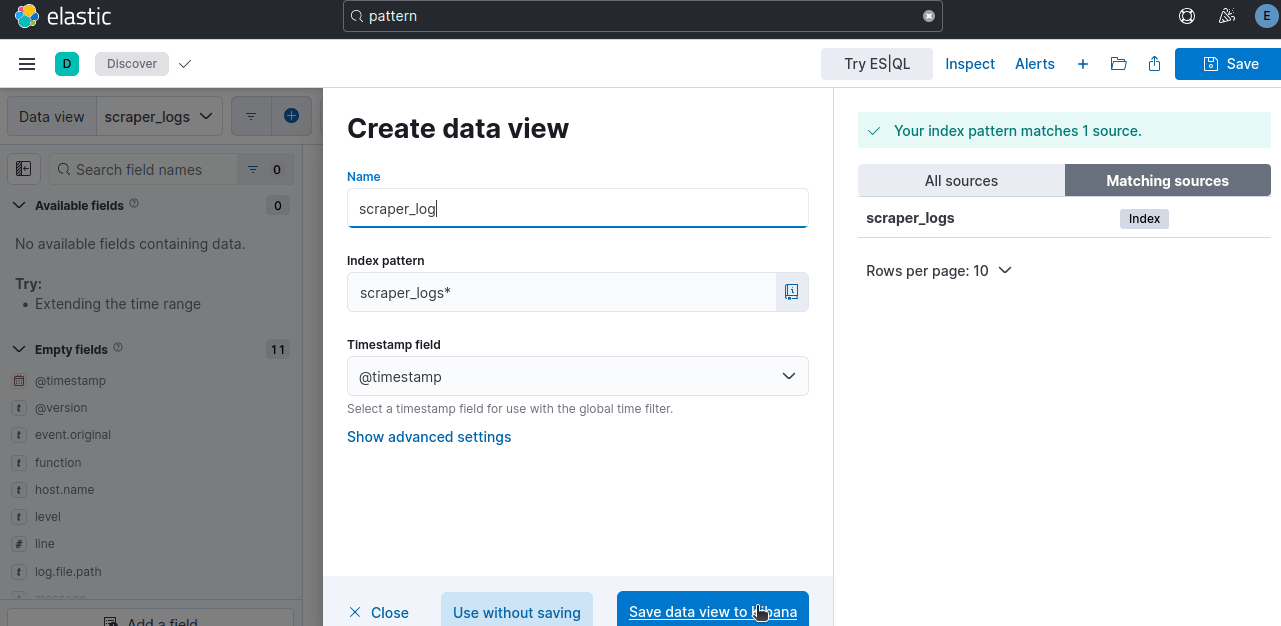
Using your Navbar, open Data Views.
If your index doesn't show up right away, click the button to create it and fill in the required fields.
If your index is called scraper_logs, your index pattern should be scraper_logs*. * is used to search all available documents in the index.
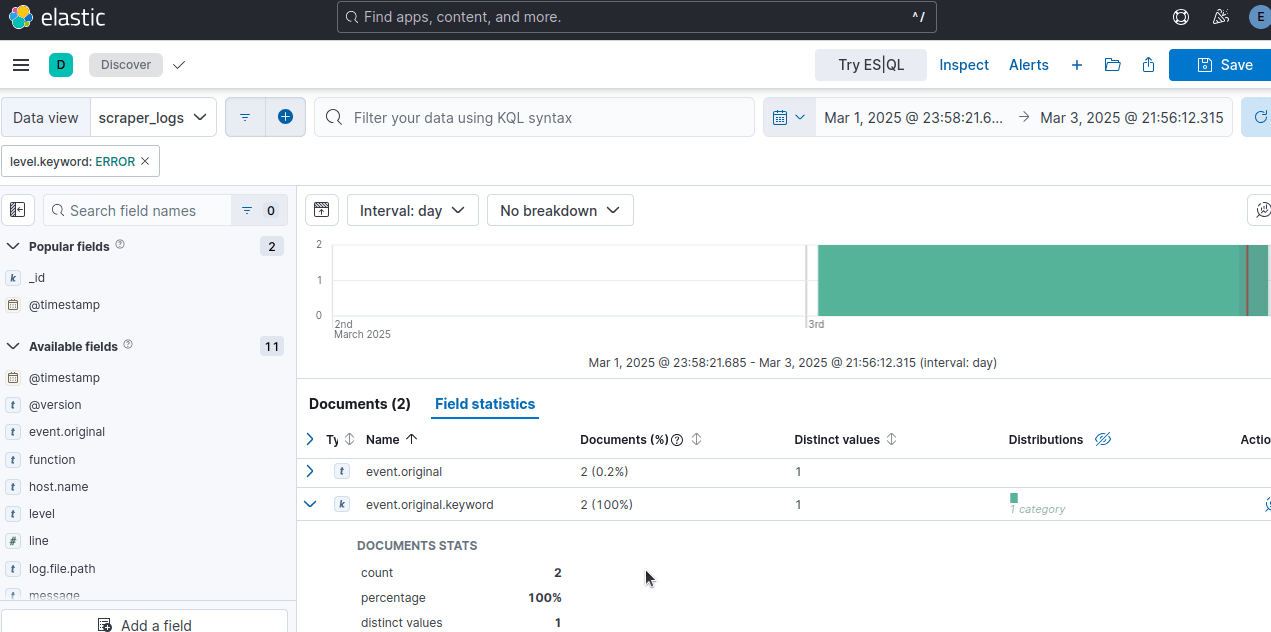
Now, you might see an empty visuals dashboard. If so, click on Search entire time range.
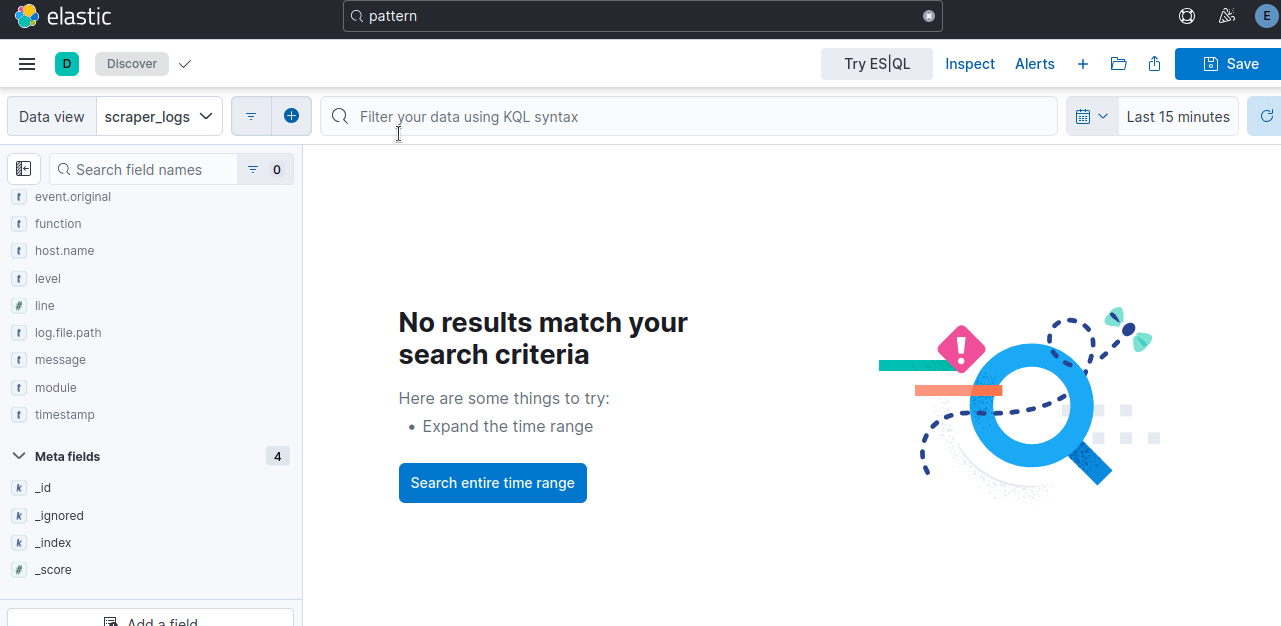
You can filter your data however you wish. Below, we filter using level.keyword:ERROR. This shows all logs with the level of ERROR.
Automating Alerts for Scraper Failures
Great, so we've got our logs in Kibana. Now, it's time to create custom alerts.
This is where Kibana really shines.
With custom alerts, you don't need to dig through log files or wait until your data pipeline breaks.
You just need to check your email or log into Kibana.
Setting Up Encryption Keys
Before we configure our alerts, we need to set up encryption keys. These keys allow Kibana to communicate securely when creating our alerts.
cd into your kibana folder. Depending on your installation method, your path may vary.
cd /usr/share/kibana/bin
Create the keys. When doing this myself, I continually received an error without using sudo.
sudo ./kibana-encryption-keys generate
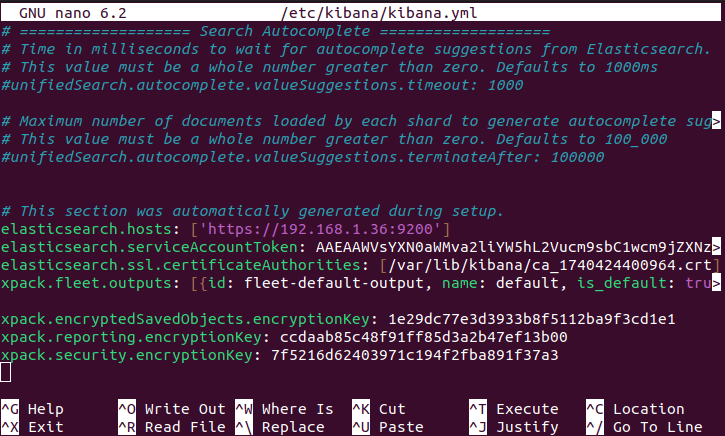
Open kibana.yml. Make sure your new keys are inside the file.
sudo nano /etc/kibana/kibana.yml
Detecting Errors with Kibana
Once your keys are in the file, restart Kibana.
sudo systemctl restart kibana
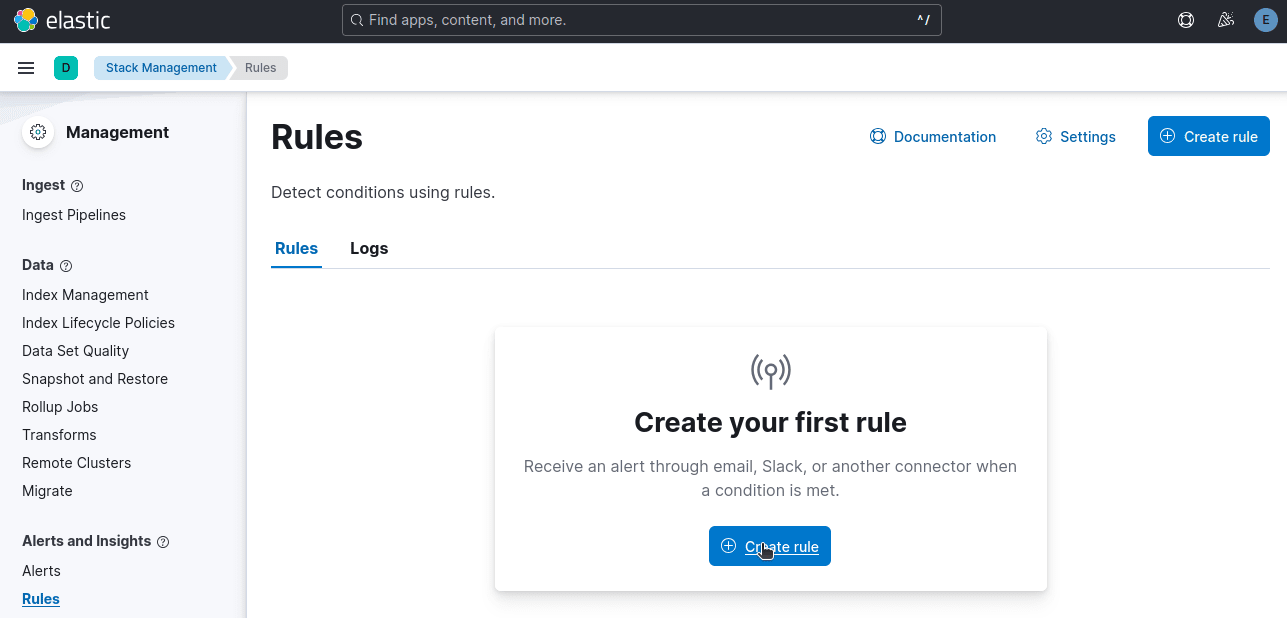
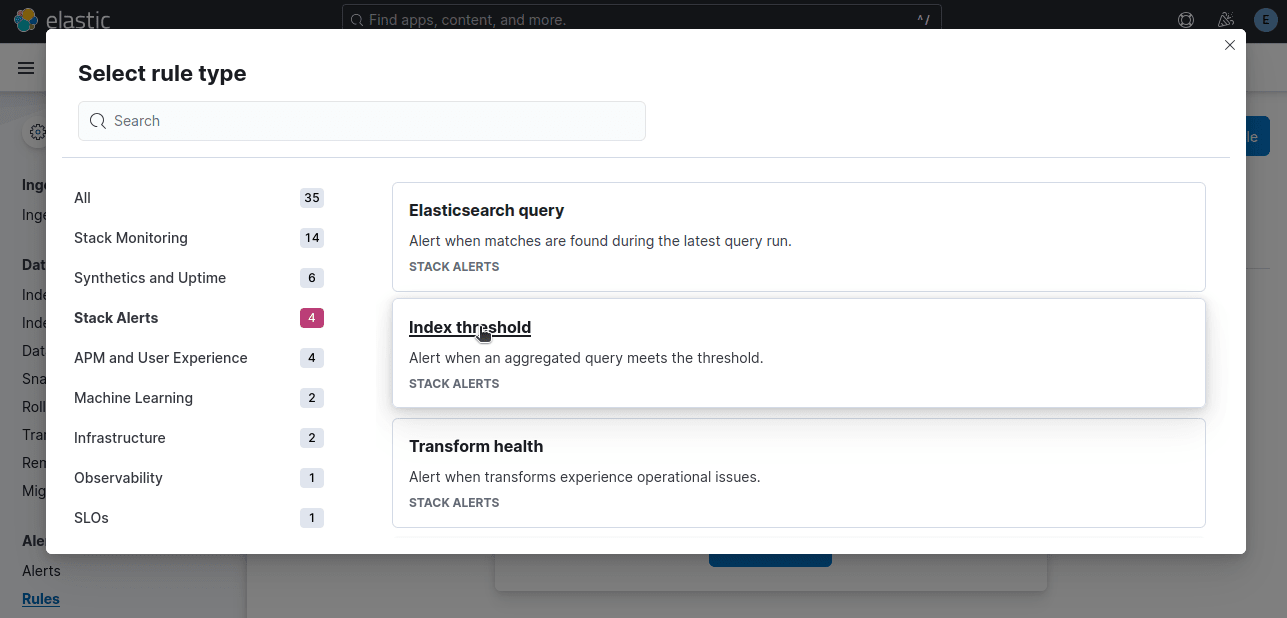
Now, it's time to create a rule. Under Stack Management, click on Create rule.
Select Index Threshold since we're setting a threshold for errors.
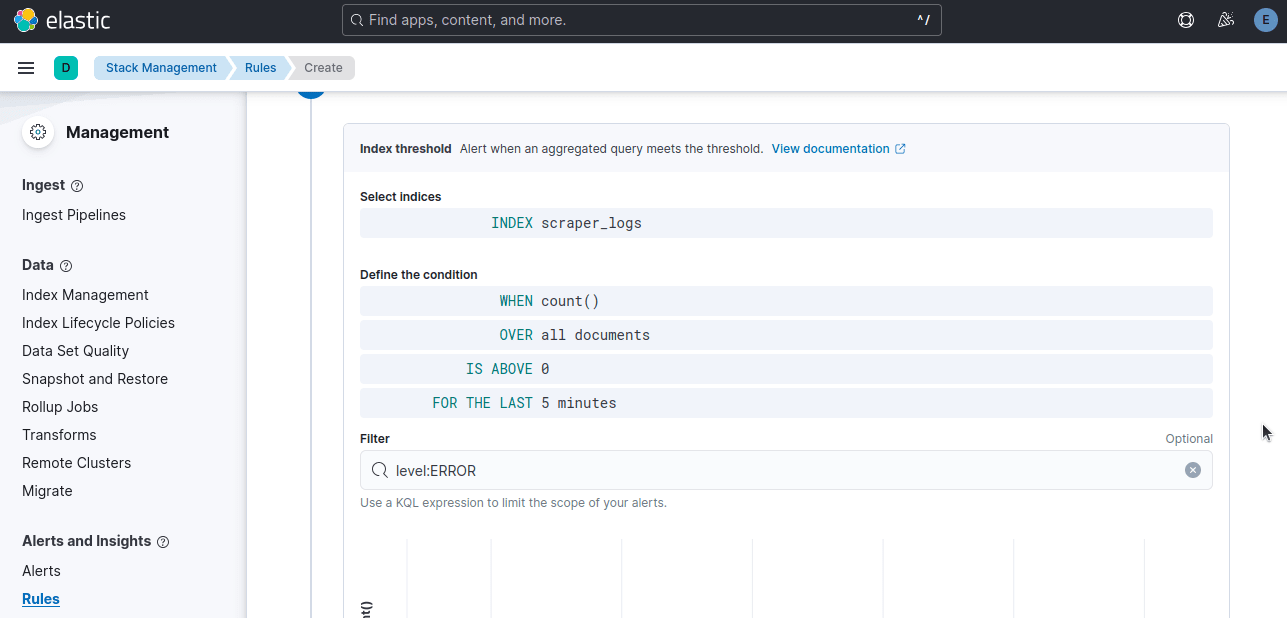
In the example below, when our count is above zero during the last 5 minutes, we want the rule to trigger. level:ERROR tells Kibana that we only want this alert to count error logs.
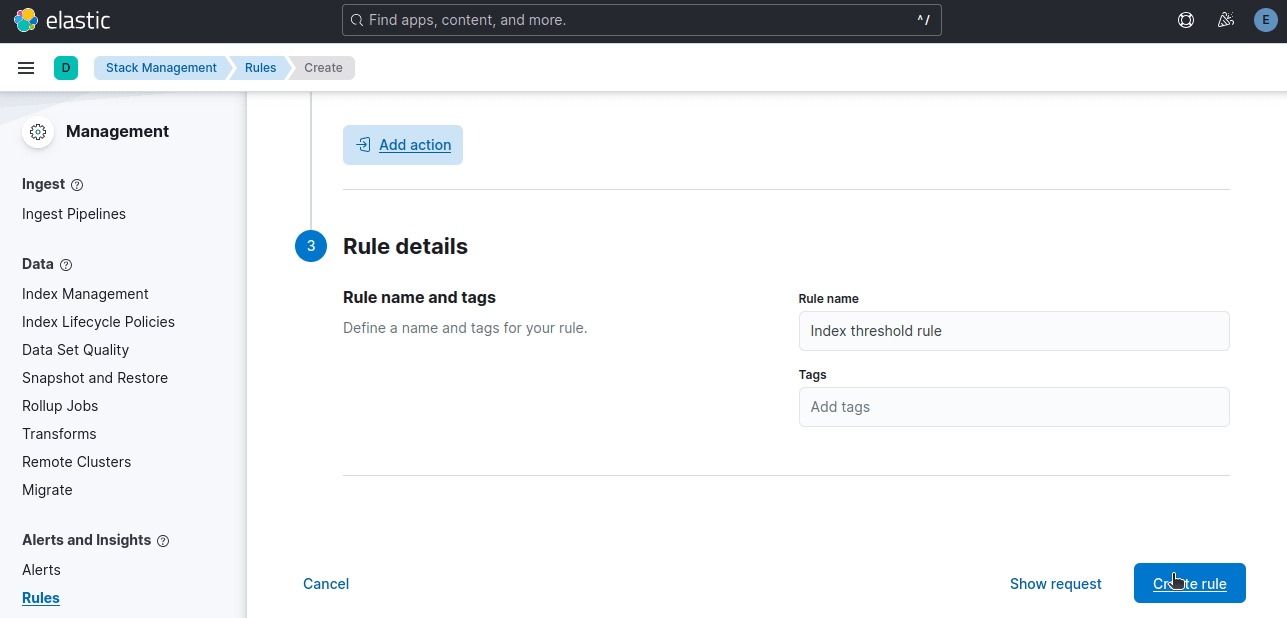
Once all of your settings are correct, click Create rule.
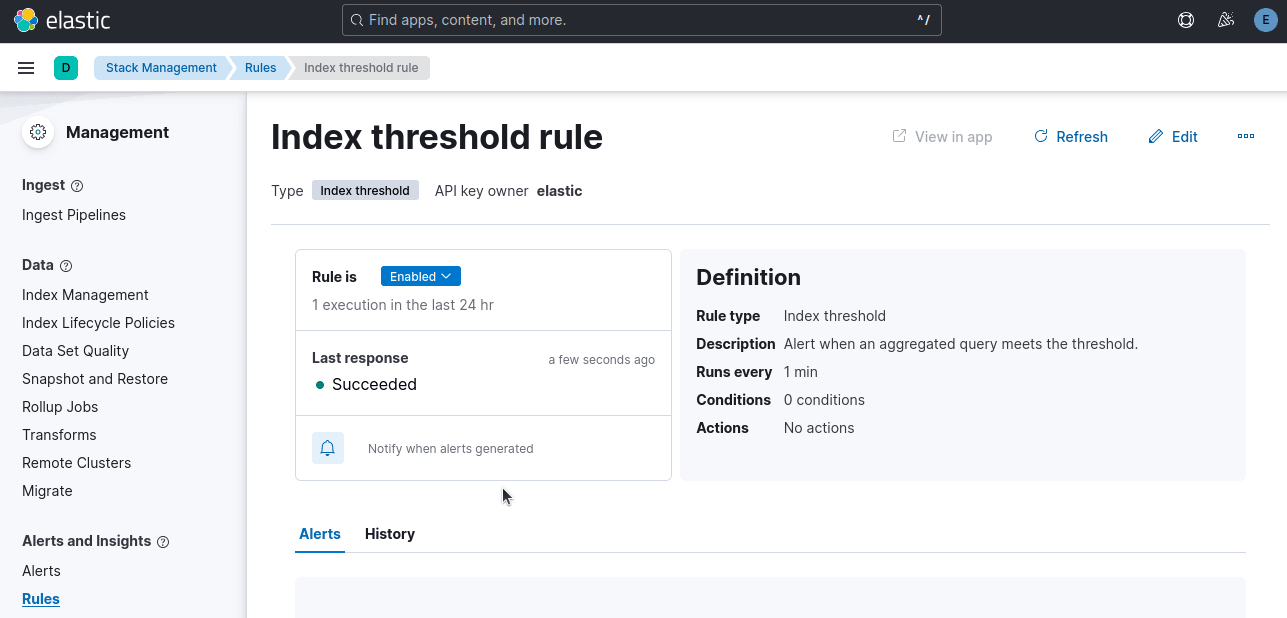
If your rule hasn't triggered yet, run your scraper to trigger an error. As you can see in the image below, our rule executed successfully.
Sending Email Alerts for Critical Failures
Okay, so we've got our rule set up. Now, it's time to send an email alert.
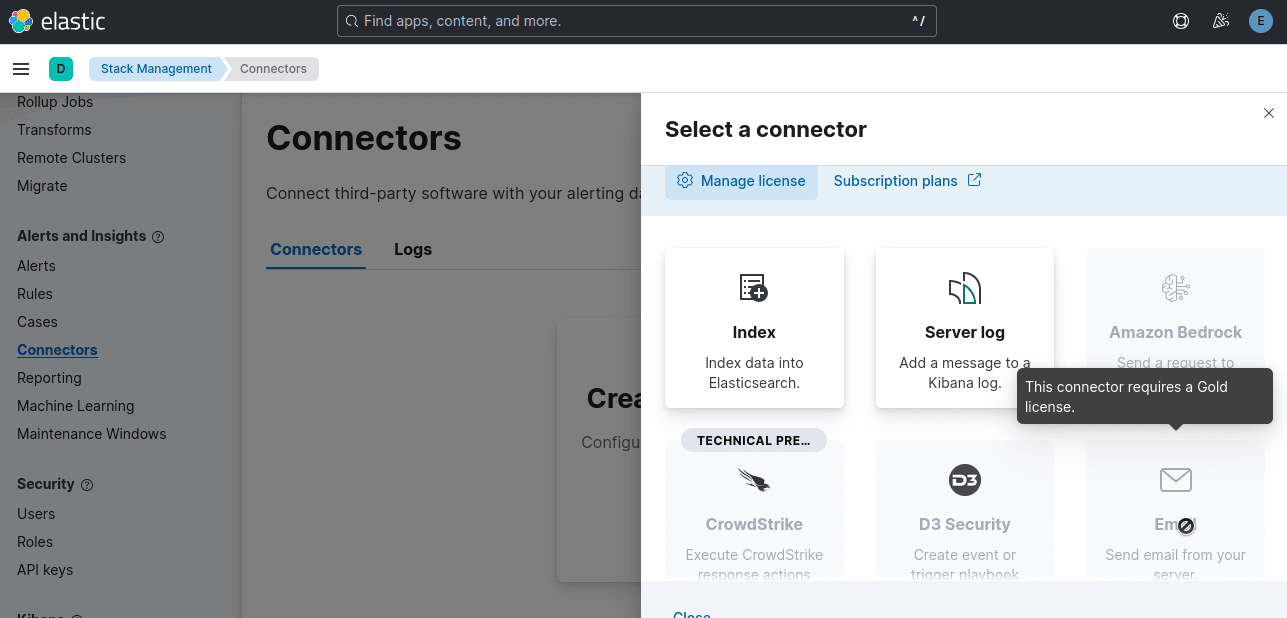
To send email alerts, navigate to Connectors and click on Create connector.
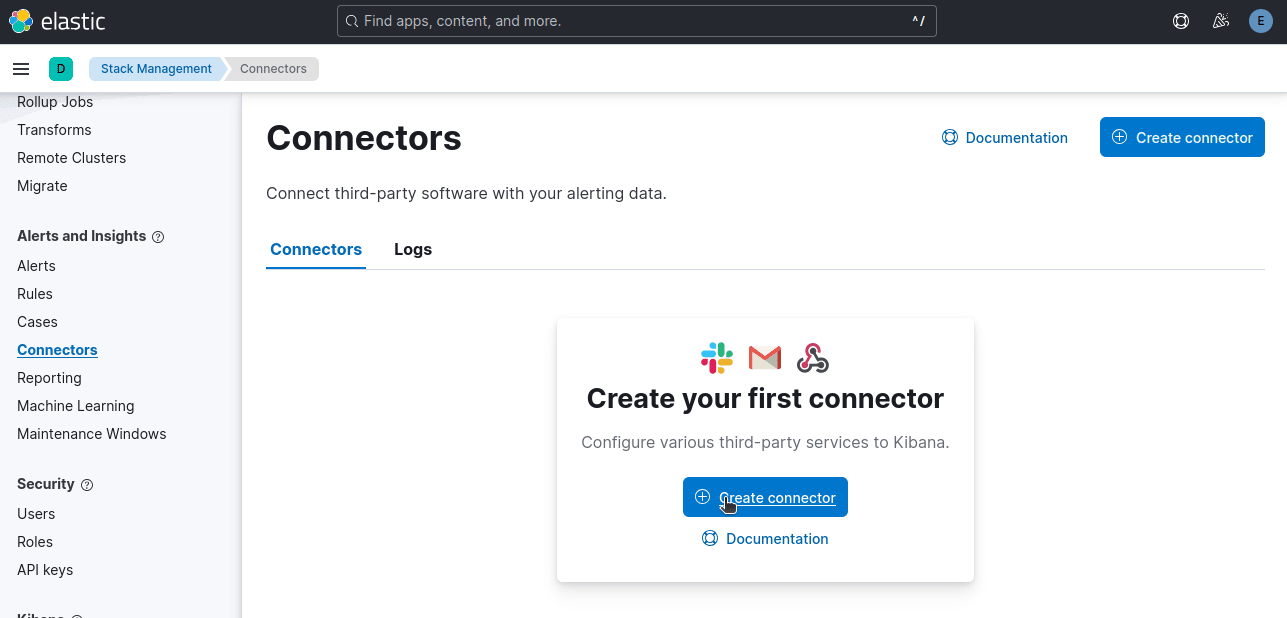
If you decide to upgrade to the Gold license, you can add any connector you want, like email or Slack. Without a Gold license, you're limited to Index and Server Log, which we already use to operate the stack.
Alternative: Setting Up Alerts in Kibana
When you created your rule, you already setup the alert.
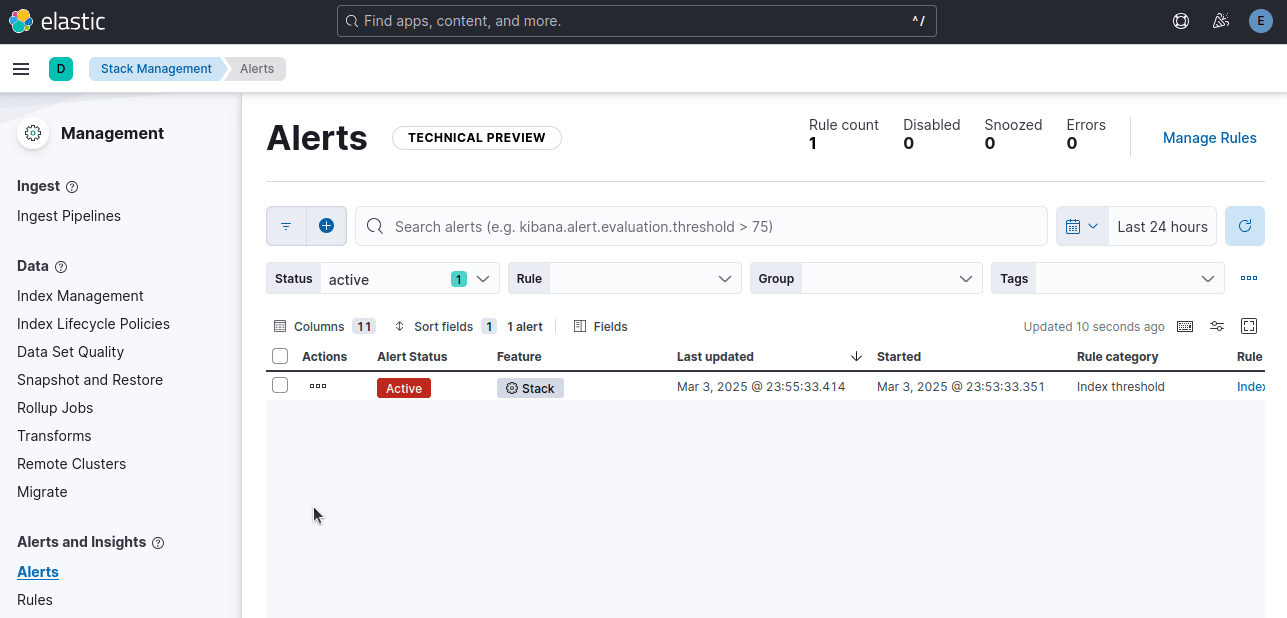
To view it, you just need to click the "Alerts" tab.
If you look at the image below, our Alert Status is Active. This is because the scraper error tripped the alert.
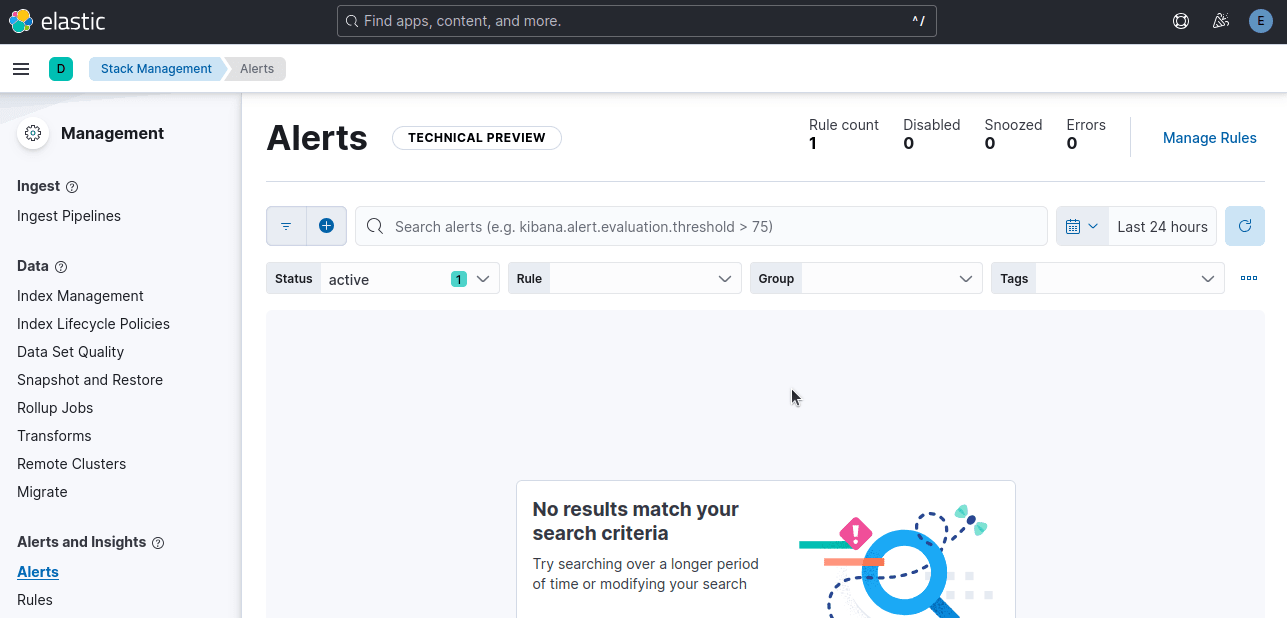
When there are no alerts present, this tab will appear empty.
Scaling Your ELK-Based Logging System
Now that ELK is humming along and catching your issues, you can take it to the next level.
You can grow your setup by adding more scrapers, logs and machines.
You don't need to worry about keeping it working, you can make it grow with your operation.
-
Cutting Log Noise: Only log when necessary in your scraper. You really only need to log when a scraper exited successfully or encountered an error.
-
Containerize: With Docker, you can build your stack locally and deploy it straight to your server with no tweaks or fuss.
-
Add Other Monitoring Tools: You can pair this stack with Prometheus and Grafana for top quality insights into your scraper health.
ELK stack gives you a strong, scalable base that will grow with you. The sky's the limit.
Tips and Troubleshooting
The following tips and troubleshooting steps are based on my own experience. If you've got other tips or suggestions, please let us know in the comments.
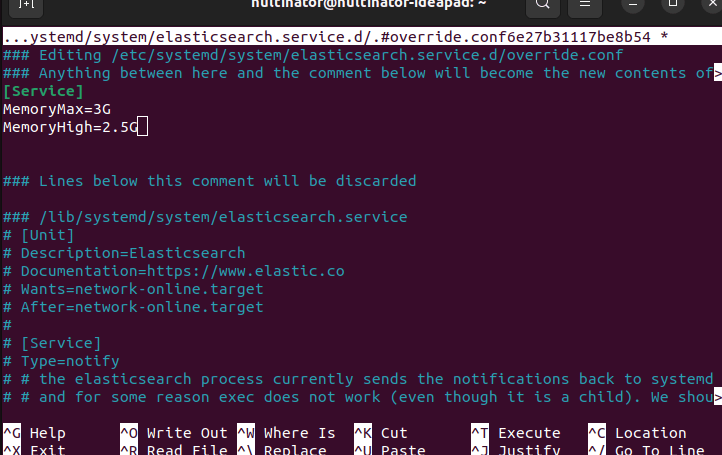
Resource Limitations
When I first set up my stack, my laptop would not stop crashing. Elasticsearch and Logstash are major resource hogs. If you don't manage their resources, they might crash yours too.
To edit Elasticsearch resource usage, just use systemctl. In the image below, I set my MemoryMax (maximum RAM used) to 3GB. MemoryHigh tells systemctl to begin reallocating memory at 2.5GB.
sudo systemctl edit elasticsearch
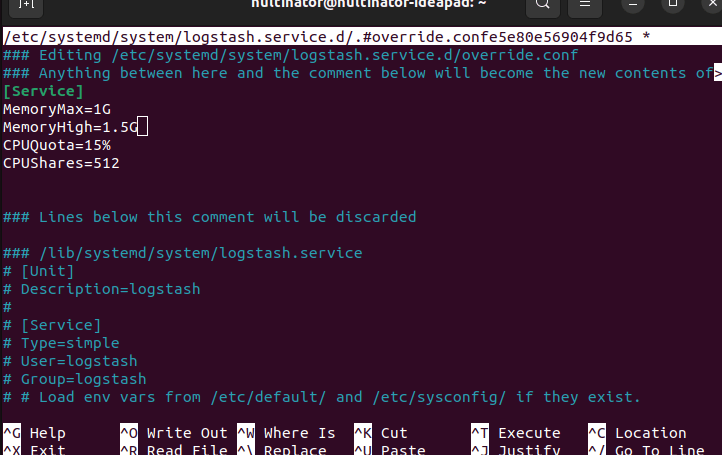
We can edit the settings for Logstash the same way.
sudo systemctl edit logstash
The CPUQuota and CPUShares will work for any program in systemctl as well.
Logstash Not Sending Documents
I also ran into file permission issues. Logstash needs to be able to read the logs. Make sure that both you and Logstash have permission to access the log file. Your scraper needs to write it and Logstash needs to read it.
The commands below create a new user group with you and Logstash and give the appropriate permissions.
# Set your user as the owner (replace 'youruser' with your actual username)
sudo chown youruser /path/to/your/logs/scraper.log

# Give the 'logstash' group read access
sudo chgrp logstash /path/to/your/logs/scraper.log

# Grant read/write to owner (youruser) and read to group (logstash)
sudo chmod u+rw,g+r /path/to/your/logs/scraper.log

# Verify permissions
ls -l /path/to/your/logs/scraper.log
Conclusion
Implementing logging and alerts with the ELK Stack transforms your web scraping game.
Gone are the days of sifting through mountains of text files or discovering errors days late. With Elasticsearch, Logstash, and Kibana, you can spot issues in real time, visualize trends, and scale your solution as your scraping projects multiply.
Once you've tamed your logs, consider weaving in additional tools like the ScrapeOps Monitoring SDK to track performance metrics and streamline scheduling. Because who wants to stare at logs 24/7?
If you've got experience with ELK stack, let us know your opinion. At ScrapeOps, we love to talk shop and compare notes.
More Web Scraping Guides
In this guide, we went through how to set up the ELK stack and use it to monitor your web scrapers.
If you would like to learn more about web scraping in general, then be sure to check out The Web Scraping Playbook, or check out one of our more in-depth guides:
Ready to take your scraping game to the next level? Check out the ScrapeOps Proxy API Aggregator for seamless proxy switching, or streamline your workflow with the ScrapeOps Scraper Scheduler.