How to Monitor Your Scrapy Spiders?
For anyone who has been in web scraping for a while, you know that if there is anything certain in web scraping that just because your scrapers work today doesn’t mean they will work tomorrow.
From day to day, your scrapers can break or their performance degrade for a whole host of reasons:
- The HTML structure of the target site can change.
- The target site can change their anti-bot countermeasures.
- Your proxy network can degrade or go down.
- Or something can go wrong on your server.
Because of this it is very important for you to have a reliable and effective way for you to monitor your scrapers in production, conduct health checks and get alerts when the performance of your spider drops.
In this guide, we will go through the 4 popular options to monitor your scrapers:
Need help scraping the web?
Then check out ScrapeOps, the complete toolkit for web scraping.
#1: Scrapy Logs & Stats
Out of the box, Scrapy boasts by far the best logging and stats functionality of any web scraping library or framework out there.
    2021-12-17 17:02:25 [scrapy.statscollectors] INFO: Dumping Scrapy stats:
    {'downloader/request_bytes': 1330,
    'downloader/request_count': 5,
    'downloader/request_method_count/GET': 5,
    'downloader/response_bytes': 11551,
    'downloader/response_count': 5,
    'downloader/response_status_count/200': 5,
    'elapsed_time_seconds': 2.600152,
    'finish_reason': 'finished',
    'finish_time': datetime.datetime(2021, 12, 17, 16, 2, 22, 118835),
    'httpcompression/response_bytes': 55120,
    'httpcompression/response_count': 5,
    'item_scraped_count': 50,
    'log_count/INFO': 10,
    'response_received_count': 5,
    'scheduler/dequeued': 5,
    'scheduler/dequeued/memory': 5,
    'scheduler/enqueued': 5,
    'scheduler/enqueued/memory': 5,
    'start_time': datetime.datetime(2021, 12, 17, 16, 2, 19, 518683)}
    2021-12-17 17:02:25 [scrapy.core.engine] INFO: Spider closed (finished)
Whereas most other scraping libraries and frameworks focus solely on making requests and parsing the responses, Scrapy has a whole logging and stats layer under the hood that tracks your spiders in real-time. Making it really easy to test and debug your spiders when developing them.
You can easily customise the logging levels, and add more stats to the default Scrapy stats in spiders with a couple lines of code.
The major problem relying solely on using this approach to monitoring your scrapers is that it quickly becomes impractical and cumbersome in production. Especially when you have multiple spiders running every day across multiple servers.
The check the health of your scraping jobs you will need to store these logs, and either periodically SSH into the server to view them or setup a custom log exporting system so you can view them in a central user interface. More on this later.
Summary
Using Scrapy's built-in logging and stats functionality is great during development, but when running scrapers in production you should look to use a better monitoring setup.
Pros
- Setup right out of the box, and very light weight.
- Easy to customise so it to logs more stats.
- Great for local testing and the development phase.
Cons
- No dashboard functionality, so you need to setup your own system to export your logs and display them.
- No historical comparison capabilities within jobs.
- No inbuilt health check functionality.
- Cumbersome to rely solely on when in production.
#2: ScrapeOps Extension
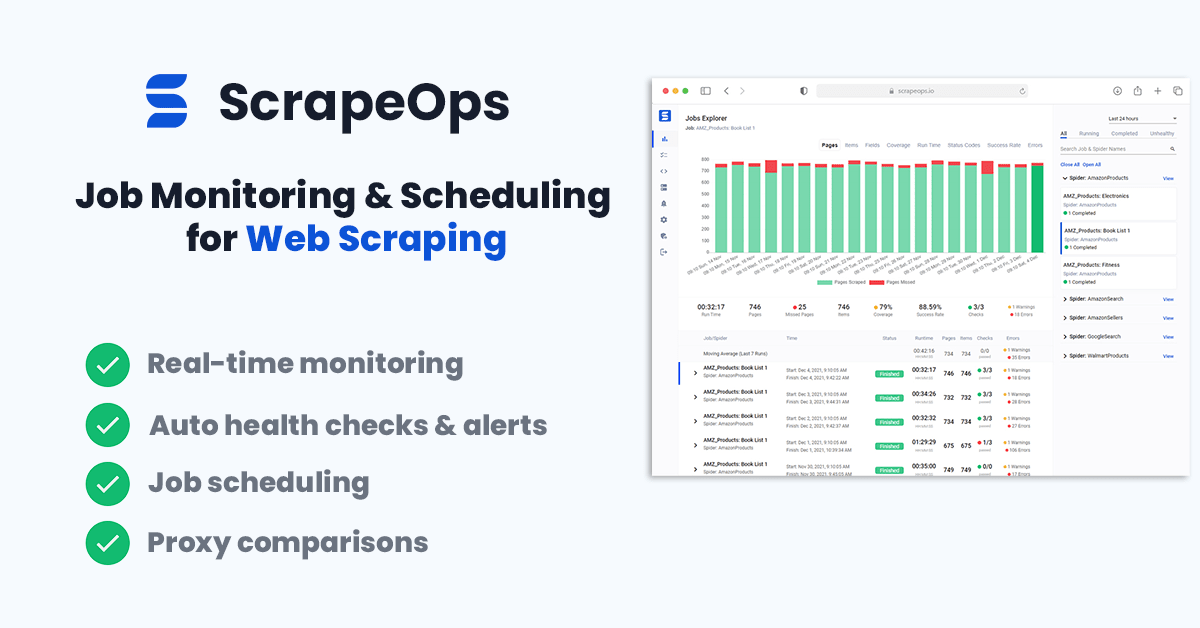
ScrapeOps is a monitoring and alerting tool dedicated to web scraping. With a simple 30 second install ScrapeOps gives you all the monitoring, alerting, scheduling and data validation functionality you need for web scraping straight out of the box.
Live demo here: ScrapeOps Demo
The primary goal with ScrapeOps is to give every developer the same level of scraping monitoring capabilities as the most sophisticated web scrapers, without any of the hassle of setting up your own custom solution.
Unlike the other options on this list, ScrapeOps is a full end-to-end web scraping monitoring and management tool dedicated to web scraping that automatically sets up all the monitors, health checks and alerts for you. If you have an issue with integrating ScrapeOps or need advice on setting up your scrapers then they have a support team on-hand to assist you.
Features
Once you have completed the simple install (3 lines in your scraper), ScrapeOps will:
- 🕵️♂️ Monitor - Automatically monitor all your scrapers.
- 📈 Dashboards - Visualise your job data in dashboards, so you see real-time & historical stats.
- 💯 Data Quality - Validate the field coverage in each of your jobs, so broken parsers can be detected straight away.
- 📉 Auto Health Checks - Automatically check every jobs performance data versus its 7 day moving average to see if its healthy or not.
- ✔️ Custom Health Checks - Check each job with any custom health checks you have enabled for it.
- ⏰ Alerts - Alert you via email, Slack, etc. if any of your jobs are unhealthy.
- 📑 Reports - Generate daily (periodic) reports, that check all jobs versus your criteria and let you know if everything is healthy or not.
Job stats tracked include:
- ✅ Pages Scraped & Missed
- ✅ Items Parsed & Missed
- ✅ Item Field Coverage
- ✅ Runtimes
- ✅ Response Status Codes
- ✅ Success Rates
- ✅ Latencies
- ✅ Errors & Warnings
- ✅ Bandwidth
Integration
Getting setup with the logger is simple. Just install the Python package:
pip install scrapeops-scrapy
And add 3 lines to your settings.py file:
    ## settings.py

    ## Add Your ScrapeOps API key
    SCRAPEOPS_API_KEY = 'YOUR_API_KEY'

    ## Add In The ScrapeOps Extension
    EXTENSIONS = {
     'scrapeops_scrapy.extension.ScrapeOpsMonitor': 500,
    }

    ## Update The Download Middlewares
    DOWNLOADER_MIDDLEWARES = {
	'scrapeops_scrapy.middleware.retry.RetryMiddleware': 550,
	'scrapy.downloadermiddlewares.retry.RetryMiddleware': None,
    }
From there, your scraping stats will be automatically logged and automatically shipped to your dashboard.

Summary
ScrapeOps is a powerful web scraping monitoring tool, that gives you all the monitoring, alerting, scheduling and data validation functionality you need for web scraping straight out of the box.
Pros
- Free unlimited community plan.
- Simple 30 second install, gives you advanced job monitoring, health checks and alerts straight out of the box.
- Job scheduling and management functionality so you can manage and monitor your scrapers from one dashboard.
- Customer support team, available to help you get setup and add new features.
Cons
- Currently, less customisable than Spidermon or other log management tools. (Will be soon!)
#3: Spidermon Extension
Spidermon is an open-source monitoring extension for Scrapy. When integrated it allows you to set up custom monitors that can run at the start, end or periodically during your scrape, and alert you via your chosen communication method.
This is a very powerful tool as it allows you to create custom monitors for each of your Spiders that can validate each Item scraped with your own unit tests.
For example, you can make sure a required field has been scraped, that a url field actually contains a valid url, or have it double check that scraped price is actually a number and doesn’t include any currency signs or special characters.
from schematics.models import Model from schematics.types import URLType, StringType, ListType
class ProductItem(Model): url = URLType(required=True) name = StringType(required=True) price = DecimalType(required=True) features = ListType(StringType) image_url = URLType()
However, the two major drawbacks with Spidermon is the fact that:
#1 - No Dashboard or User Interface�
Spidermon doesn’t have any dashboard or user interface where you can see the output of your monitors.
The output of your Spidermon monitors are just added to your log files and Scrapy stats, so you will either need to view each spider log to check your scrapers performance or setup a custom system to extract this log data and display it in your own custom dashboard.
#2 - Upfront Setup Time
Unlike, ScrapeOps with Spidermon you will have to spend a bit of upfront time to create the monitors you need for each spider and integrate them into your Scrapy projects.
Spidermon does include some out-of-the-box monitors, however, you will still need to activate them and define the failure thresholds for every spider.
Features
Once setup Spidermon can:
- 🕵️♂️ Monitor - Automatically, monitor all your scrapers with the defined monitors.
- 💯 Data Quality - Validate the field coverage each of the Items you've defined unit tests for.
- 📉 Periodic/Finished Health Checks - At periodic intervals or at job finish, you can configure Spidermon to check the health of your job versus pre-set thresholds.
- ⏰ Alerts - Alert you via email, Slack, etc. if any of your jobs are unhealthy.
Job stats tracked out of the box include:
- ✅ Pages Scraped
- ✅ Items Scraped
- ✅ Item Field Coverage
- ✅ Runtimes
- ✅ Errors & Warnings
You can also track more stats if you customise your scrapers to log them and have spidermon monitor them.
Integration
Getting setup with Spidermon is straight forward, but you do need to manually setup your monitors after installing the Spidermon extension.
To get started you need to install the Python package:
pip install spidermon
Then add 2 lines to your settings.py file:
    ## settings.py

    ## Enable Spidermon
    SPIDERMON_ENABLED = True

    ## Add In The Spidermon Extension
    EXTENSIONS = {
    'spidermon.contrib.scrapy.extensions.Spidermon': 500,
    }
From here you will also need to build your custom monitors and add each of them to your settings.py file. Here is a simple example of how to setup a monitor that will check the number of items scraped at the end of the job versus a fixed threshold.
First we create a custom monitor in a monitors.py file within our Scrapy project:
    # my_project/monitors.py
    from spidermon import Monitor, MonitorSuite, monitors

    @monitors.name('Item count')
    class ItemCountMonitor(Monitor):

        @monitors.name('Minimum number of items')
        def test_minimum_number_of_items(self):
            item_extracted = getattr(
                self.data.stats, 'item_scraped_count', 0)
            minimum_threshold = 10

            msg = 'Extracted less than {} items'.format(
                minimum_threshold)
            self.assertTrue(
                item_extracted >= minimum_threshold, msg=msg
            )

    class SpiderCloseMonitorSuite(MonitorSuite):

        monitors = [
            ItemCountMonitor,
        ]
Then we add this to monitor to our settings.py file so that Spidermon will run it at the end of every job.
    ## settings.py

    ## Enable Spidermon Monitor
    SPIDERMON_SPIDER_CLOSE_MONITORS = (
        'my_project.monitors.SpiderCloseMonitorSuite',
    )
This monitor will then run at the end of every job and output the result in your logs file. Example of monitor failing its tests:
    INFO: [Spidermon] -------------------- MONITORS --------------------
    INFO: [Spidermon] Item count/Minimum number of items... FAIL
    INFO: [Spidermon] --------------------------------------------------
    ERROR: [Spidermon]
    ====================================================================
    FAIL: Item count/Minimum number of items
    --------------------------------------------------------------------
    Traceback (most recent call last):
    File "/tutorial/monitors.py",
        line 17, in test_minimum_number_of_items
        item_extracted >= minimum_threshold, msg=msg
    AssertionError: False is not true : Extracted less than 10 items
    INFO: [Spidermon] 1 monitor in 0.001s
    INFO: [Spidermon] FAILED (failures=1)
    INFO: [Spidermon] ---------------- FINISHED ACTIONS ----------------
    INFO: [Spidermon] --------------------------------------------------
    INFO: [Spidermon] 0 actions in 0.000s
    INFO: [Spidermon] OK
    INFO: [Spidermon] ----------------- PASSED ACTIONS -----------------
    INFO: [Spidermon] --------------------------------------------------
    INFO: [Spidermon] 0 actions in 0.000s
    INFO: [Spidermon] OK
    INFO: [Spidermon] ----------------- FAILED ACTIONS -----------------
    INFO: [Spidermon] --------------------------------------------------
    INFO: [Spidermon] 0 actions in 0.000s
    INFO: [Spidermon] OK
If you would like a more detailed explanation of how to use Spidermon, you can check out our Complete Spidermon Guide here or the offical documentation here.
Summary
Spidermon is a great option for anyone who is wants to take their scrapers to the next level and integrate a highly customisable monitoring solution.
Pros
- Open-source. Developed by core Scrapy developers.
- Stable and battle tested. Used internally by Zyte developers.
- Offers the ability to set custom item validation rules on every Item being scraped.
Cons
- No dashboard functionality, so you need to build your own system to extract the Spidermon stats to a dashboard.
- Need to do a decent bit of customisation in your Scrapy projects to get the spider monitors, alerts, etc. setup for each spider.
#4: Generic Logging & Monitoring Tools
Another option, is use any of the many active monitoring or logging platforms available, like DataDog, Logz.io, LogDNA, Sentry, etc.
These tools boast a huge range of functionality and features that allow you to graph, filter, aggregate your log data in whatever way best suits your requirements.
However, although that can be used for monitoring your spiders, you will have to do a lot of customisation work to setup the dashboards, monitors, alerts like you would get with ScrapeOps or Spidermon.
Plus, because with most of these tools you will need to ingest all your log data to power the graphs, monitors, etc. they will likely be a lot more expensive than using ScrapeOps or Spidermon as they charge based on much data they ingest and how long they retain it for.
Summary
If you have a very unique web scraping stack with a complicated ETL pipeline, then customising one of the big logging tools to your requirements might be a good option.
Pros
- Lots of feature rich logging tools to choose from.
- Can integrate with your other logging stack if you have on.
- Highly customisable. If you can dream it, then you can likely build it.
Cons
- Will need to create a custom logging setup to properly track your jobs.
- No job management or scheduling capabilities.
- Can get expensive when doing large scale scraping.
More Scrapy Tutorials
That's it for all the ways you can monitor your Scrapy spiders. If you would like to learn more about Scrapy, then be sure to check out The Scrapy Playbook.